FRED Graph

Your trusted data source
since 1991.
Source: U.S. Bureau of Labor Statistics
Release: Producer Price Index
Units:
Frequency:
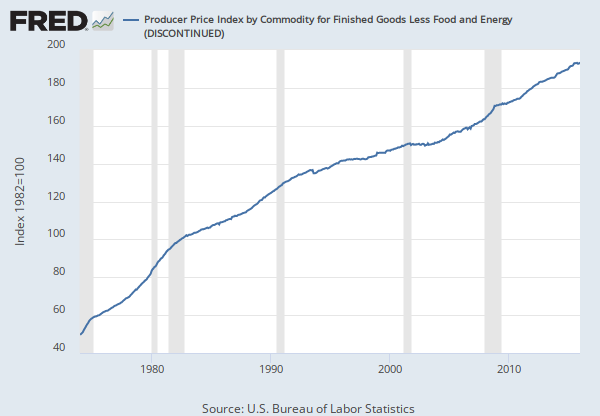
In January 2014, the Producer Price Index (PPI) transitioned from the Stage of Processing (SOP) aggregation system to the Final Demand-Intermediate Demand (FD-ID) aggregation system. Effective with the January 2016 Producer Price Index (PPI) data release in February 2016, PPI ceased the calculation and publication of the Stage of Processing (SOP) versions of these indexes. Going forward, data users wishing to track prices for finished goods, processed goods for intermediate demand (intermediate goods), unprocessed goods for intermediate demand (crude goods), or any of the former SOP-based component indexes will need to use the corresponding index codes from the Final Demand-Intermediate Demand (FD-ID) aggregation system. The FD-ID aggregation system webpage provides a table listing the SOP indexes and their concordant FD-ID indexes. https://www.bls.gov/ppi/fdidconcordance.htm
The data series has transitioned from the Stage of Processing (SOP) aggregation system to the Final Demand-Intermediate Demand (FD-ID). All Stage of Processing (SOP) data series have been discontinued. Please see the replacement for the data series at: https://fred.stlouisfed.org/series/WPSID621
U.S. Bureau of Labor Statistics, Producer Price Index by Commodity for Crude Foodstuffs and Feedstuffs (DISCONTINUED) [PPICFF], retrieved from FRED, Federal Reserve Bank of St. Louis; https://fred.stlouisfed.org/series/PPICFF, May 15, 2024.
Source: U.S. Bureau of Labor Statistics
Release: Consumer Price Index
Units:
Frequency:
The Consumer Price Index for All Urban Consumers: All Items (CPIAUCSL) is a price index of a basket of goods and services paid by urban consumers. Percent changes in the price index measure the inflation rate between any two time periods. The most common inflation metric is the percent change from one year ago. It can also represent the buying habits of urban consumers. This particular index includes roughly 88 percent of the total population, accounting for wage earners, clerical workers, technical workers, self-employed, short-term workers, unemployed, retirees, and those not in the labor force.
The CPIs are based on prices for food, clothing, shelter, and fuels; transportation fares; service fees (e.g., water and sewer service); and sales taxes. Prices are collected monthly from about 4,000 housing units and approximately 26,000 retail establishments across 87 urban areas. To calculate the index, price changes are averaged with weights representing their importance in the spending of the particular group. The index measures price changes (as a percent change) from a predetermined reference date. In addition to the original unadjusted index distributed, the Bureau of Labor Statistics also releases a seasonally adjusted index. The unadjusted series reflects all factors that may influence a change in prices. However, it can be very useful to look at the seasonally adjusted CPI, which removes the effects of seasonal changes, such as weather, school year, production cycles, and holidays.
The CPI can be used to recognize periods of inflation and deflation. Significant increases in the CPI within a short time frame might indicate a period of inflation, and significant decreases in CPI within a short time frame might indicate a period of deflation. However, because the CPI includes volatile food and oil prices, it might not be a reliable measure of inflationary and deflationary periods. For a more accurate detection, the core CPI (CPILFESL) is often used. When using the CPI, please note that it is not applicable to all consumers and should not be used to determine relative living costs. Additionally, the CPI is a statistical measure vulnerable to sampling error since it is based on a sample of prices and not the complete average.
For more information on the consumer price indexes, see:
Bureau of Economic Analysis. "CPI Detailed Report." 2013.
Handbook of Methods
Understanding the CPI: Frequently Asked Questions
U.S. Bureau of Labor Statistics, Consumer Price Index for All Urban Consumers: All Items in U.S. City Average [CPIAUCSL], retrieved from FRED, Federal Reserve Bank of St. Louis; https://fred.stlouisfed.org/series/CPIAUCSL, May 15, 2024.
Source: U.S. Census Bureau
Release: Monthly Wholesale Trade: Sales and Inventories
Units:
Frequency:
Definition of inventories (as provided by the Census Bureau): The value, at cost, of merchandise on hand and available for sale at the end of the reference month. All goods owned by a firm, regardless of location, except goods outside the United States are included. Items not held for resale, such as fixtures, equipment, and supplies are excluded. Also excluded is the value of goods on a firm's premises but not owned by the firm. (http://www.census.gov/wholesale/definitions.html)
U.S. Census Bureau, Merchant Wholesalers, Except Manufacturers' Sales Branches and Offices: Nondurable Goods: Grocery and Related Products Inventories [I4244IM144SCEN], retrieved from FRED, Federal Reserve Bank of St. Louis; https://fred.stlouisfed.org/series/I4244IM144SCEN, May 15, 2024.
Source: U.S. Census Bureau
Release: Monthly Wholesale Trade: Sales and Inventories
Units:
Frequency:
U.S. Census Bureau, Merchant Wholesalers, Except Manufacturers' Sales Branches and Offices: Nondurable Goods: Grocery and Related Products Sales [S4244SM144SCEN], retrieved from FRED, Federal Reserve Bank of St. Louis; https://fred.stlouisfed.org/series/S4244SM144SCEN, May 15, 2024.
Source: U.S. Census Bureau
Release: Manufacturing and Trade Inventories and Sales
Units:
Frequency:
The inventories to sales ratios show the relationship of the end-of-month values of inventory to the monthly sales. These ratios can be looked at as indications of the number of months of inventory that are on hand in relation to the sales for a month. For example, a ratio of 2.5 would indicate that wholesalers have enough merchandise on hand to cover two and a half months of sales.
U.S. Census Bureau, Merchant Wholesalers: Inventories to Sales Ratio [WHLSLRIRSA], retrieved from FRED, Federal Reserve Bank of St. Louis; https://fred.stlouisfed.org/series/WHLSLRIRSA, May 15, 2024.
Consumer Price Index for All Urban Consumers: All Items in U.S. City Average
Monthly, Not Seasonally Adjusted Semiannual, Not Seasonally AdjustedMerchant Wholesalers, Except Manufacturers' Sales Branches and Offices: Nondurable Goods: Grocery and Related Products Inventories
Monthly, Not Seasonally Adjusted Percent, Monthly, Not Seasonally Adjusted Percent, Monthly, Seasonally AdjustedMerchant Wholesalers, Except Manufacturers' Sales Branches and Offices: Nondurable Goods: Grocery and Related Products Sales
Monthly, Not Seasonally Adjusted Percent, Monthly, Not Seasonally Adjusted Percent, Monthly, Seasonally AdjustedMerchant Wholesalers: Inventories to Sales Ratio
Monthly, Not Seasonally Adjusted