FRED Graph

Your trusted data source
since 1991.
Source: Board of Governors of the Federal Reserve System (US)
Release: H.6 Money Stock Measures
Units:
Frequency:
Before May 2020, M2 consists of M1 plus (1) savings deposits (including money market deposit accounts); (2) small-denomination time deposits (time deposits in amounts of less than $100,000) less individual retirement account (IRA) and Keogh balances at depository institutions; and (3) balances in retail money market funds (MMFs) less IRA and Keogh balances at MMFs.
Beginning May 2020, M2 consists of M1 plus (1) small-denomination time deposits (time deposits in amounts of less than $100,000) less IRA and Keogh balances at depository institutions; and (2) balances in retail MMFs less IRA and Keogh balances at MMFs. Seasonally adjusted M2 is constructed by summing savings deposits (before May 2020), small-denomination time deposits, and retail MMFs, each seasonally adjusted separately, and adding this result to seasonally adjusted M1.
For more information on the H.6 release changes and the regulatory amendment that led to the creation of the other liquid deposits component and its inclusion in the M1 monetary aggregate, see the H.6 announcements and Technical Q&As posted on December 17, 2020.
Board of Governors of the Federal Reserve System (US), M2 [M2SL], retrieved from FRED, Federal Reserve Bank of St. Louis; https://fred.stlouisfed.org/series/M2SL, May 17, 2024.
Source: Board of Governors of the Federal Reserve System (US)
Release: H.6 Money Stock Measures
Units:
Frequency:
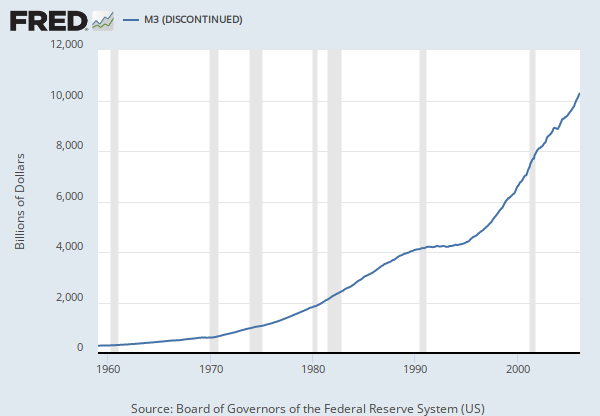
This series has been discontinued and will no longer be updated. Starting on February 23, 2021, the H.6 statistical release is now published at a monthly frequency and contains only monthly average data needed to construct the monetary aggregates, thereby eliminating the release of data on institutional money funds and memorandum items on U.S. government deposits and deposits due to foreign banks and foreign official institutions. For further information about the changes to the H.6 Statistical Release, see the announcements provided by the source.
Institutional money funds are constructed from weekly data collected by the Investment Company Institute (ICI), a trade association for the investment company industry.
Board of Governors of the Federal Reserve System (US), Institutional Money Market Funds (DISCONTINUED) [IMFSL], retrieved from FRED, Federal Reserve Bank of St. Louis; https://fred.stlouisfed.org/series/IMFSL, May 17, 2024.
Source: Board of Governors of the Federal Reserve System (US)
Release: H.8 Assets and Liabilities of Commercial Banks in the United States
Units:
Frequency:
For further information, please refer to the Board of Governors of the Federal Reserve System's H.8 release, online at http://www.federalreserve.gov/releases/h8/.
Board of Governors of the Federal Reserve System (US), Cash Assets, All Commercial Banks [CASACBM027NBOG], retrieved from FRED, Federal Reserve Bank of St. Louis; https://fred.stlouisfed.org/series/CASACBM027NBOG, May 17, 2024.
Source: U.S. Census Bureau
Source: U.S. Department of Housing and Urban Development
Release: New Residential Sales
Units:
Frequency:
U.S. Census Bureau and U.S. Department of Housing and Urban Development, New One Family Houses Sold: United States [HSN1F], retrieved from FRED, Federal Reserve Bank of St. Louis; https://fred.stlouisfed.org/series/HSN1F, May 17, 2024.
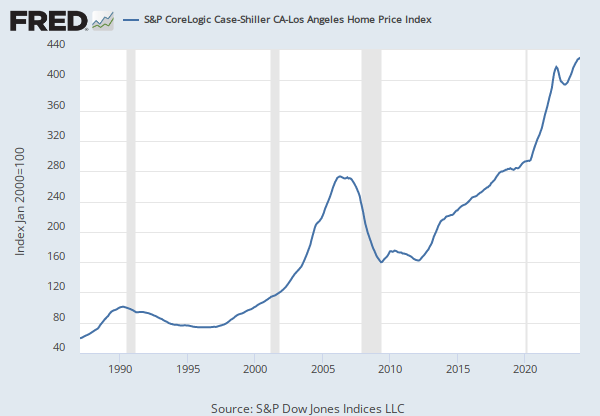
Source: S&P Dow Jones Indices LLC
Release: S&P CoreLogic Case-Shiller Home Price Indices
Units:
Frequency:
For more information regarding the index, please visit Standard and Poor's.
Copyright © 2016, S&P Dow Jones Indices LLC. All rights reserved. Reproduction of S&P Case-Shiller 20-City Home Price Index in any form is prohibited except with the prior written permission of S&P Dow Jones Indices LLC "S&P". S&P does not guarantee the accuracy, adequacy, completeness or availability of any information and is not responsible for any errors or omissions, regardless of the cause or for the results obtained from the use of such information. S&P DISCLAIMS ANY AND ALL EXPRESS OR IMPLIED WARRANTIES, INCLUDING, BUT NOT LIMITED TO, ANY WARRANTIES OF MERCHANTABILITY OR FITNESS FOR A PARTICULAR PURPOSE OR USE. In no event shall S&P be liable for any direct, indirect, special or consequential damages, costs, expenses, legal fees, or losses (including lost income or lost profit and opportunity costs) in connection with subscriber's or others' user of S&P Case-Shiller 20-City Home Price Index.
Permission to reproduce this series can be requested from index_services@spdji.com. More contact details are available, including phone numbers for all regional offices.
S&P Dow Jones Indices LLC, S&P CoreLogic Case-Shiller 20-City Composite Home Price Index [SPCS20RSA], retrieved from FRED, Federal Reserve Bank of St. Louis; https://fred.stlouisfed.org/series/SPCS20RSA, May 17, 2024.
Source: S&P Dow Jones Indices LLC
Release: S&P CoreLogic Case-Shiller Home Price Indices
Units:
Frequency:
For more information regarding the index, please visit Standard & Poor's.
Copyright © 2016, S&P Dow Jones Indices LLC. All rights reserved. Reproduction of S&P Case-Shiller 10-City Home Price Index in any form is prohibited except with the prior written permission of S&P Dow Jones Indices LLC "S&P". S&P does not guarantee the accuracy, adequacy, completeness or availability of any information and is not responsible for any errors or omissions, regardless of the cause or for the results obtained from the use of such information. S&P DISCLAIMS ANY AND ALL EXPRESS OR IMPLIED WARRANTIES, INCLUDING, BUT NOT LIMITED TO, ANY WARRANTIES OF MERCHANTABILITY OR FITNESS FOR A PARTICULAR PURPOSE OR USE. In no event shall S&P be liable for any direct, indirect, special or consequential damages, costs, expenses, legal fees, or losses (including lost income or lost profit and opportunity costs) in connection with subscriber's or others' user of S&P Case-Shiller 10-City Home Price Index.
Permission to reproduce this series can be requested from index_services@spdji.com. More contact details are available from http://us.spindices.com/contact-us/, including phone numbers for all of its regional offices.
S&P Dow Jones Indices LLC, S&P CoreLogic Case-Shiller 10-City Composite Home Price Index [SPCS10RSA], retrieved from FRED, Federal Reserve Bank of St. Louis; https://fred.stlouisfed.org/series/SPCS10RSA, May 17, 2024.
Source: U.S. Bureau of Labor Statistics
Release: Consumer Price Index
Units:
Frequency:
The Consumer Price Index for All Urban Consumers: All Items (CPIAUCSL) is a price index of a basket of goods and services paid by urban consumers. Percent changes in the price index measure the inflation rate between any two time periods. The most common inflation metric is the percent change from one year ago. It can also represent the buying habits of urban consumers. This particular index includes roughly 88 percent of the total population, accounting for wage earners, clerical workers, technical workers, self-employed, short-term workers, unemployed, retirees, and those not in the labor force.
The CPIs are based on prices for food, clothing, shelter, and fuels; transportation fares; service fees (e.g., water and sewer service); and sales taxes. Prices are collected monthly from about 4,000 housing units and approximately 26,000 retail establishments across 87 urban areas. To calculate the index, price changes are averaged with weights representing their importance in the spending of the particular group. The index measures price changes (as a percent change) from a predetermined reference date. In addition to the original unadjusted index distributed, the Bureau of Labor Statistics also releases a seasonally adjusted index. The unadjusted series reflects all factors that may influence a change in prices. However, it can be very useful to look at the seasonally adjusted CPI, which removes the effects of seasonal changes, such as weather, school year, production cycles, and holidays.
The CPI can be used to recognize periods of inflation and deflation. Significant increases in the CPI within a short time frame might indicate a period of inflation, and significant decreases in CPI within a short time frame might indicate a period of deflation. However, because the CPI includes volatile food and oil prices, it might not be a reliable measure of inflationary and deflationary periods. For a more accurate detection, the core CPI (CPILFESL) is often used. When using the CPI, please note that it is not applicable to all consumers and should not be used to determine relative living costs. Additionally, the CPI is a statistical measure vulnerable to sampling error since it is based on a sample of prices and not the complete average.
For more information on the consumer price indexes, see:
Bureau of Economic Analysis. "CPI Detailed Report." 2013.
Handbook of Methods
Understanding the CPI: Frequently Asked Questions
U.S. Bureau of Labor Statistics, Consumer Price Index for All Urban Consumers: All Items in U.S. City Average [CPIAUCSL], retrieved from FRED, Federal Reserve Bank of St. Louis; https://fred.stlouisfed.org/series/CPIAUCSL, May 17, 2024.
Source: U.S. Bureau of Economic Analysis
Release: Personal Income and Outlays
Units:
Frequency:
BEA Account Code: A034RC
A Guide to the National Income and Product Accounts of the United States (NIPA) - (http://www.bea.gov/national/pdf/nipaguid.pdf)
U.S. Bureau of Economic Analysis, Compensation of Employees, Received: Wage and Salary Disbursements [A576RC1], retrieved from FRED, Federal Reserve Bank of St. Louis; https://fred.stlouisfed.org/series/A576RC1, May 17, 2024.
Source: U.S. Bureau of Economic Analysis
Release: Personal Income and Outlays
Units:
Frequency:
BEA Account Code: A067RX
AGuide to the National Income and Product Accounts of the United States (NIPA)
U.S. Bureau of Economic Analysis, Real Disposable Personal Income [DSPIC96], retrieved from FRED, Federal Reserve Bank of St. Louis; https://fred.stlouisfed.org/series/DSPIC96, May 17, 2024.
Source: U.S. Bureau of Economic Analysis
Release: Personal Income and Outlays
Units:
Frequency:
Population includes resident population plus armed forces overseas. The monthly estimate is the average of estimates for the first of the month and the first of the following month.
BEA Account Code: B230RC
A Guide to the National Income and Product Accounts of the United States (NIPA) - (http://www.bea.gov/national/pdf/nipaguid.pdf)
U.S. Bureau of Economic Analysis, Population [POPTHM], retrieved from FRED, Federal Reserve Bank of St. Louis; https://fred.stlouisfed.org/series/POPTHM, May 17, 2024.
M2
Monthly, Not Seasonally Adjusted Weekly, Not Seasonally AdjustedInstitutional Money Market Funds (DISCONTINUED)
Monthly, Not Seasonally Adjusted Weekly, Not Seasonally Adjusted Weekly, Seasonally AdjustedCash Assets, All Commercial Banks
Monthly, Seasonally Adjusted Weekly, Not Seasonally Adjusted Weekly, Seasonally Adjusted Percent Change at Annual Rate, Annual, Seasonally Adjusted Percent Change at Annual Rate, Monthly, Seasonally Adjusted Percent Change at Annual Rate, Quarterly, Seasonally AdjustedNew One Family Houses Sold: United States
Thousands of Units, Annual, Not Seasonally Adjusted Thousands of Units, Monthly, Not Seasonally AdjustedS&P CoreLogic Case-Shiller 20-City Composite Home Price Index
Monthly, Not Seasonally AdjustedS&P CoreLogic Case-Shiller 10-City Composite Home Price Index
Monthly, Not Seasonally AdjustedConsumer Price Index for All Urban Consumers: All Items in U.S. City Average
Monthly, Not Seasonally Adjusted Semiannual, Not Seasonally AdjustedReal Disposable Personal Income
Quarterly, Seasonally Adjusted Annual Rate Percent Change from Preceding Period, Annual, Not Seasonally Adjusted Percent Change from Preceding Period, Quarterly, Seasonally Adjusted Annual Rate Percent Change from Quarter One Year Ago, Quarterly, Seasonally AdjustedPopulation
Annual, Not Seasonally Adjusted Quarterly, Not Seasonally Adjusted