FRED Graph

Your trusted data source
since 1991.
Source: U.S. Bureau of Labor Statistics
Release: Employment Situation
Units:
Frequency:
Production and related employees include working supervisors and all nonsupervisory employees (including group leaders and trainees) engaged in fabricating, processing, assembling, inspecting, receiving, storing, handling, packing, warehousing, shipping, trucking, hauling, maintenance, repair, janitorial, guard services, product development, auxiliary production for plant's own use (for example, power plant), recordkeeping, and other services closely associated with the above production operations.
#Nonsupervisory employees include those individuals in private, service-providing industries who are not above the working-supervisor level. This group includes individuals such as office and clerical workers, repairers, salespersons, operators, drivers, physicians, lawyers, accountants, nurses, social workers, research aides, teachers, drafters, photographers, beauticians, musicians, restaurant workers, custodial workers, attendants, line installers and repairers, laborers, janitors, guards, and other employees at similar occupational levels whose services are closely associated with those of the employees listed.
The series comes from the 'Current Employment Statistics (Establishment Survey).'
The source code is: CES0500000008
U.S. Bureau of Labor Statistics, Average Hourly Earnings of Production and Nonsupervisory Employees, Total Private [AHETPI], retrieved from FRED, Federal Reserve Bank of St. Louis; https://fred.stlouisfed.org/series/AHETPI, May 12, 2024.
Source: U.S. Bureau of Labor Statistics
Release: Consumer Price Index
Units:
Frequency:
The Consumer Price Index for All Urban Consumers: All Items (CPIAUCSL) is a price index of a basket of goods and services paid by urban consumers. Percent changes in the price index measure the inflation rate between any two time periods. The most common inflation metric is the percent change from one year ago. It can also represent the buying habits of urban consumers. This particular index includes roughly 88 percent of the total population, accounting for wage earners, clerical workers, technical workers, self-employed, short-term workers, unemployed, retirees, and those not in the labor force.
The CPIs are based on prices for food, clothing, shelter, and fuels; transportation fares; service fees (e.g., water and sewer service); and sales taxes. Prices are collected monthly from about 4,000 housing units and approximately 26,000 retail establishments across 87 urban areas. To calculate the index, price changes are averaged with weights representing their importance in the spending of the particular group. The index measures price changes (as a percent change) from a predetermined reference date. In addition to the original unadjusted index distributed, the Bureau of Labor Statistics also releases a seasonally adjusted index. The unadjusted series reflects all factors that may influence a change in prices. However, it can be very useful to look at the seasonally adjusted CPI, which removes the effects of seasonal changes, such as weather, school year, production cycles, and holidays.
The CPI can be used to recognize periods of inflation and deflation. Significant increases in the CPI within a short time frame might indicate a period of inflation, and significant decreases in CPI within a short time frame might indicate a period of deflation. However, because the CPI includes volatile food and oil prices, it might not be a reliable measure of inflationary and deflationary periods. For a more accurate detection, the core CPI (CPILFESL) is often used. When using the CPI, please note that it is not applicable to all consumers and should not be used to determine relative living costs. Additionally, the CPI is a statistical measure vulnerable to sampling error since it is based on a sample of prices and not the complete average.
For more information on the consumer price indexes, see:
Bureau of Economic Analysis. "CPI Detailed Report." 2013.
Handbook of Methods
Understanding the CPI: Frequently Asked Questions
U.S. Bureau of Labor Statistics, Consumer Price Index for All Urban Consumers: All Items in U.S. City Average [CPIAUCSL], retrieved from FRED, Federal Reserve Bank of St. Louis; https://fred.stlouisfed.org/series/CPIAUCSL, May 12, 2024.
Source: S&P Dow Jones Indices LLC
Release: Standard & Poors
Units:
Frequency:
The observations for the S&P 500 represent the daily index value at market close. The market typically closes at 4 PM ET, except for holidays when it sometimes closes early.
The Federal Reserve Bank of St. Louis and S&P Dow Jones Indices LLC have reached a new agreement on the use of Standard & Poors and Dow Jones Averages series in FRED. FRED and its associated services will include 10 years of daily history for Standard & Poors and Dow Jones Averages series.
The S&P 500 is regarded as a gauge of the large cap U.S. equities market. The index includes 500 leading companies in leading industries of the U.S. economy, which are publicly held on either the NYSE or NASDAQ, and covers 75% of U.S. equities. Since this is a price index and not a total return index, the S&P 500 index here does not contain dividends.
Copyright © 2016, S&P Dow Jones Indices LLC. All rights reserved. Reproduction of S&P 500 in any form is prohibited except with the prior written permission of S&P Dow Jones Indices LLC ("S&P"). S&P does not guarantee the accuracy, adequacy, completeness or availability of any information and is not responsible for any errors or omissions, regardless of the cause or for the results obtained from the use of such information. S&P DISCLAIMS ANY AND ALL EXPRESS OR IMPLIED WARRANTIES, INCLUDING, BUT NOT LIMITED TO, ANY WARRANTIES OF MERCHANTABILITY OR FITNESS FOR A PARTICULAR PURPOSE OR USE. In no event shall S&P be liable for any direct, indirect, special or consequential damages, costs, expenses, legal fees, or losses (including lost income or lost profit and opportunity costs) in connection with subscriber's or others' use of S&P 500.
Permission to reproduce S&P 500 can be requested from index_services@spdji.com. More contact details are available here, including phone numbers for all regional offices.
S&P Dow Jones Indices LLC, S&P 500 [SP500], retrieved from FRED, Federal Reserve Bank of St. Louis; https://fred.stlouisfed.org/series/SP500, May 12, 2024.
Source: Board of Governors of the Federal Reserve System (US)
Release: H.15 Selected Interest Rates
Units:
Frequency:
Averages of business days. For further information regarding treasury constant maturity data, please refer to the H.15 Statistical Release notes and the Treasury Yield Curve Methodology.
Board of Governors of the Federal Reserve System (US), Market Yield on U.S. Treasury Securities at 10-Year Constant Maturity, Quoted on an Investment Basis [GS10], retrieved from FRED, Federal Reserve Bank of St. Louis; https://fred.stlouisfed.org/series/GS10, May 12, 2024.
Source: Board of Governors of the Federal Reserve System (US)
Release: H.15 Selected Interest Rates
Units:
Frequency:
Averages of business days. For further information regarding treasury constant maturity data, please refer to the H.15 Statistical Release notes and the Treasury Yield Curve Methodology.
Board of Governors of the Federal Reserve System (US), Market Yield on U.S. Treasury Securities at 1-Year Constant Maturity, Quoted on an Investment Basis [GS1], retrieved from FRED, Federal Reserve Bank of St. Louis; https://fred.stlouisfed.org/series/GS1, May 12, 2024.
Source: Board of Governors of the Federal Reserve System (US)
Release: H.15 Selected Interest Rates
Units:
Frequency:
Averages of daily figures.
For additional historical federal funds rate data, please see Daily Federal Funds Rate from 1928-1954.
The federal funds rate is the interest rate at which depository institutions trade federal funds (balances held at Federal Reserve Banks) with each other overnight. When a depository institution has surplus balances in its reserve account, it lends to other banks in need of larger balances. In simpler terms, a bank with excess cash, which is often referred to as liquidity, will lend to another bank that needs to quickly raise liquidity. (1) The rate that the borrowing institution pays to the lending institution is determined between the two banks; the weighted average rate for all of these types of negotiations is called the effective federal funds rate.(2) The effective federal funds rate is essentially determined by the market but is influenced by the Federal Reserve through open market operations to reach the federal funds rate target.(2)
The Federal Open Market Committee (FOMC) meets eight times a year to determine the federal funds target rate. As previously stated, this rate influences the effective federal funds rate through open market operations or by buying and selling of government bonds (government debt).(2) More specifically, the Federal Reserve decreases liquidity by selling government bonds, thereby raising the federal funds rate because banks have less liquidity to trade with other banks. Similarly, the Federal Reserve can increase liquidity by buying government bonds, decreasing the federal funds rate because banks have excess liquidity for trade. Whether the Federal Reserve wants to buy or sell bonds depends on the state of the economy. If the FOMC believes the economy is growing too fast and inflation pressures are inconsistent with the dual mandate of the Federal Reserve, the Committee may set a higher federal funds rate target to temper economic activity. In the opposing scenario, the FOMC may set a lower federal funds rate target to spur greater economic activity. Therefore, the FOMC must observe the current state of the economy to determine the best course of monetary policy that will maximize economic growth while adhering to the dual mandate set forth by Congress. In making its monetary policy decisions, the FOMC considers a wealth of economic data, such as: trends in prices and wages, employment, consumer spending and income, business investments, and foreign exchange markets.
The federal funds rate is the central interest rate in the U.S. financial market. It influences other interest rates such as the prime rate, which is the rate banks charge their customers with higher credit ratings. Additionally, the federal funds rate indirectly influences longer- term interest rates such as mortgages, loans, and savings, all of which are very important to consumer wealth and confidence.(2)
References
(1) Federal Reserve Bank of New York. "Federal funds." Fedpoints, August 2007.
(2) Board of Governors of the Federal Reserve System. "Monetary Policy".
Board of Governors of the Federal Reserve System (US), Federal Funds Effective Rate [FEDFUNDS], retrieved from FRED, Federal Reserve Bank of St. Louis; https://fred.stlouisfed.org/series/FEDFUNDS, May 12, 2024.
Source: U.S. Bureau of Labor Statistics
Release: Employment Situation
Units:
Frequency:
The unemployment rate represents the number of unemployed as a percentage of the labor force. Labor force data are restricted to people 16 years of age and older, who currently reside in 1 of the 50 states or the District of Columbia, who do not reside in institutions (e.g., penal and mental facilities, homes for the aged), and who are not on active duty in the Armed Forces.
This rate is also defined as the U-3 measure of labor underutilization.
The series comes from the 'Current Population Survey (Household Survey)'
The source code is: LNS14000000
U.S. Bureau of Labor Statistics, Unemployment Rate [UNRATE], retrieved from FRED, Federal Reserve Bank of St. Louis; https://fred.stlouisfed.org/series/UNRATE, May 12, 2024.
Source: Board of Governors of the Federal Reserve System (US)
Release: G.17 Industrial Production and Capacity Utilization
Units:
Frequency:
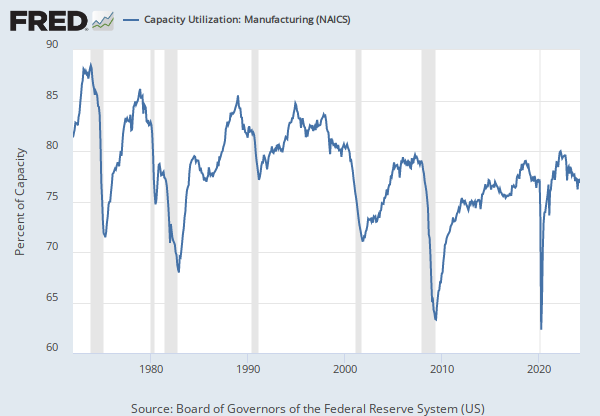
For a given industry, the capacity utilization rate is equal to an output index divided by a capacity index. The Federal Reserve Board's capacity indexes attempt to capture the concept of sustainable maximum output-the greatest level of output a plant can maintain within the framework of a realistic work schedule, after factoring in normal downtime and assuming sufficient availability of inputs to operate the capital in place.
For more information, see the explanatory notes issued by the Board of Governors. For recent updates, see the announcements issued by the Board of Governors
Source Code: CAPUTL.B50001.S
Board of Governors of the Federal Reserve System (US), Capacity Utilization: Total Index [TCU], retrieved from FRED, Federal Reserve Bank of St. Louis; https://fred.stlouisfed.org/series/TCU, May 12, 2024.
Average Hourly Earnings of Production and Nonsupervisory Employees, Total Private
Monthly, Not Seasonally AdjustedConsumer Price Index for All Urban Consumers: All Items in U.S. City Average
Monthly, Not Seasonally Adjusted Semiannual, Not Seasonally AdjustedMarket Yield on U.S. Treasury Securities at 10-Year Constant Maturity, Quoted on an Investment Basis
Annual, Not Seasonally Adjusted Daily, Not Seasonally Adjusted Weekly, Not Seasonally AdjustedMarket Yield on U.S. Treasury Securities at 1-Year Constant Maturity, Quoted on an Investment Basis
Annual, Not Seasonally Adjusted Daily, Not Seasonally Adjusted Weekly, Not Seasonally AdjustedFederal Funds Effective Rate
Annual, Not Seasonally Adjusted Biweekly, Not Seasonally Adjusted Daily, Not Seasonally Adjusted Daily, Not Seasonally Adjusted Weekly, Not Seasonally AdjustedUnemployment Rate
Monthly, Not Seasonally AdjustedCapacity Utilization: Total Index
Annual, Seasonally Adjusted Quarterly, Seasonally Adjusted