FRED Graph

Your trusted data source
since 1991.
Source: Federal Reserve Bank of St. Louis
Release: Money Velocity
Units:
Frequency:
Calculated as the ratio of quarterly nominal GDP (GDP) to the quarterly average of M1 money stock (M1SL)
The velocity of money is the frequency at which one unit of currency is used to purchase domestically- produced goods and services within a given time period. In other words, it is the number of times one dollar is spent to buy goods and services per unit of time. If the velocity of money is increasing, then more transactions are occurring between individuals in an economy.
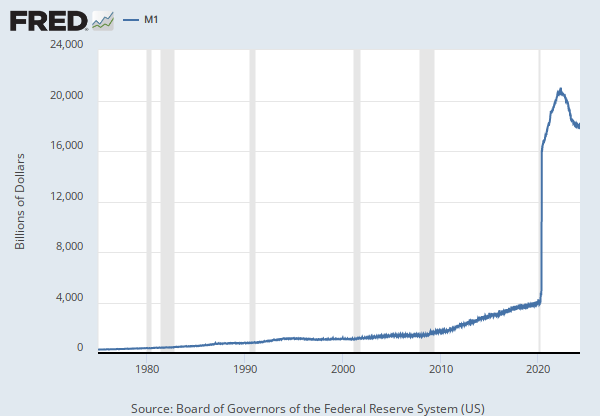
The frequency of currency exchange can be used to determine the velocity of a given component of the money supply, providing some insight into whether consumers and businesses are saving or spending their money. There are several components of the money supply,: M1, M2, and MZM (M3 is no longer tracked by the Federal Reserve); these components are arranged on a spectrum of narrowest to broadest. Consider M1, the narrowest component. M1 is the money supply of currency in circulation (notes and coins, demand deposits, and other liquid deposits). A decreasing velocity of M1 might indicate fewer short- term consumption transactions are taking place. We can think of shorter- term transactions as consumption we might make on an everyday basis.
Beginning May 2020, M1 consists of (1) currency outside the U.S. Treasury, Federal Reserve Banks, and the vaults of depository institutions; (2) demand deposits at commercial banks (excluding those amounts held by depository institutions, the U.S. government, and foreign banks and official institutions) less cash items in the process of collection and Federal Reserve float; and (3) other liquid deposits, consisting of OCDs and savings deposits (including money market deposit accounts). Seasonally adjusted M1 is constructed by summing currency, demand deposits, and OCDs (before May 2020) or other liquid deposits (beginning May 2020), each seasonally adjusted separately. For more information on the H.6 release changes and the regulatory amendment that led to the creation of the other liquid deposits component and its inclusion in the M1 monetary aggregate, see the H.6 announcements and Technical Q&As posted on December 17, 2020.
The broader M2 component includes M1 in addition to saving deposits, certificates of deposit (less than $100,000), and money market deposits for individuals. Comparing the velocities of M1 and M2 provides some insight into how quickly the economy is spending and how quickly it is saving.
MZM (money with zero maturity) is the broadest component and consists of the supply of financial assets redeemable at par on demand: notes and coins in circulation, traveler’s checks (non-bank issuers), demand deposits, other checkable deposits, savings deposits, and all money market funds. The velocity of MZM helps determine how often financial assets are switching hands within the economy.
Federal Reserve Bank of St. Louis, Velocity of M1 Money Stock [M1V], retrieved from FRED, Federal Reserve Bank of St. Louis; https://fred.stlouisfed.org/series/M1V, June 1, 2024.
Source: U.S. Bureau of Economic Analysis
Release: Gross Domestic Product
Units:
Frequency:
BEA Account Code: A191RD
The number of decimal places reported varies over time. A Guide to the National Income and Product Accounts of the United States (NIPA).
U.S. Bureau of Economic Analysis, Gross Domestic Product: Implicit Price Deflator [GDPDEF], retrieved from FRED, Federal Reserve Bank of St. Louis; https://fred.stlouisfed.org/series/GDPDEF, June 1, 2024.
Source: U.S. Bureau of Economic Analysis
Release: Gross Domestic Product
Units:
Frequency:
BEA Account Code: A191RX
Real gross domestic product is the inflation adjusted value of the goods and services produced by labor and property located in the United States.For more information see the Guide to the National Income and Product Accounts of the United States (NIPA). For more information, please visit the Bureau of Economic Analysis.
U.S. Bureau of Economic Analysis, Real Gross Domestic Product [GDPC1], retrieved from FRED, Federal Reserve Bank of St. Louis; https://fred.stlouisfed.org/series/GDPC1, June 1, 2024.
Source: U.S. Office of Management and Budget
Source: Federal Reserve Bank of St. Louis
Release: Debt to Gross Domestic Product Ratios
Units:
Frequency:
Federal Surplus or Deficit [-] as Percent of Gross Domestic Product (FYFSGDA188S) was first constructed by the Federal Reserve Bank of St. Louis in October 2012. It is calculated using Federal Surplus or Deficit [-] (FYFSD) and Gross Domestic Product (GDPA):
FYFSGDA188S = ((FYFSD/1000)/GDPA)*100
FYFSD/1000 transforms FYFSD from millions of dollars to billions of dollars.
U.S. Office of Management and Budget and Federal Reserve Bank of St. Louis, Federal Surplus or Deficit [-] as Percent of Gross Domestic Product [FYFSGDA188S], retrieved from FRED, Federal Reserve Bank of St. Louis; https://fred.stlouisfed.org/series/FYFSGDA188S, June 1, 2024.
Gross Domestic Product: Implicit Price Deflator
Percent Change from Preceding Period, Annual, Not Seasonally Adjusted Percent Change from Preceding Period, Quarterly, Seasonally Adjusted Annual RateReal Gross Domestic Product
Annual, Not Seasonally Adjusted Quarterly, Not Seasonally Adjusted Index 2017=100, Quarterly, Not Seasonally Adjusted Percent Change from Preceding Period, Annual, Not Seasonally Adjusted Percent Change from Preceding Period, Quarterly, Seasonally Adjusted Annual Rate Percent Change from Quarter One Year Ago, Quarterly, Not Seasonally Adjusted Percent Change from Quarter One Year Ago, Quarterly, Seasonally AdjustedFederal Surplus or Deficit [-] as Percent of Gross Domestic Product
Annual, Not Seasonally Adjusted