
US Barriers to International Trade of Goods: Tariffs and Non-Tariff Measures
International trade can be critical for economic growth and development, connecting countries and businesses across the world.1 While trade barriers have consistently decreased in recent decades, leading to the unprecedented growth of trade linkages, significant barriers remain across countries: The US is no exception. Barriers hinder the free flow of goods and services between countries and hurt economies and consumers alike. In this essay, we document the prevalence of barriers to international trade in the US.
One challenge when characterizing the extent of barriers in a given country is the variety of policies through which countries may limit trade. Here, we take a comprehensive look at trade barriers in the US by partitioning policies into two types: tariffs and non-tariff measures (NTMs).2 Tariffs are taxes on imports expressed as a percentage of the total value imported, effectively raising the price of imports and making domestic substitutes more attractive. Non-tariff measures encompass a broad range of policies and regulations that can also limit the free flow of goods, such as quotas, licenses, and technical standards.
We document the prevalence of these policies in the US using data for 2014 collected by the World Bank and the United Nations Conference on Trade and Development, which are publicly available through the Trade Analysis Information System and World Integrated Trade Solutions.3

We analyze the prevalence of tariffs and NTMs in the US across industries. Panel A of Figure 1 displays average ad valorem tariffs across industries. These values vary significantly across industries, from less than 1% in Wood and Machinery/Electrical to over 11% in Textiles and Footwear/Headgear. While explaining the sources underlying this variability is beyond the scope of this essay, they may be accounted for by using idiosyncratic sectoral characteristics such as their relative value, safety, or competition concerns. However, we observe that tariffs are relatively low on average, below 6% after excluding industries related to textiles.
Panel B of Figure 1 documents the prevalence of non-tariff measures in the US. One issue with NTMs is that the variety of instruments in place makes them harder to compare. Thus, for each industry, we report the coverage ratio: the share of industry-level imports subject to some type of NTM. One drawback of this measure is that it restricts attention to the share of goods subject to an NTM, abstracting from the intensity in which an industry distorts imports.4 In contrast to tariffs, NTMs are ubiquitous across US imports in all industries. For instance, in half the industries, NTMs cover more than 70% of total imports. There is nevertheless significant variability across industries: Metals and Minerals have fairly low coverage, while Animals and Textiles/Clothing have over 90% of their import value covered by some form of NTM.
These findings suggest that NTMs may be a significant barrier to trade in the US. The intended goal of tariffs is to distort international trade flows, often in the interest of protecting domestic industries. In contrast, NTMs may be in place to achieve some other goal, and their distortions of international trade flows may just be collateral damage the US pays to fulfill these other goals. For instance, NTMs are often introduced to regulate the safety of imports of medicine and food, ensuring imports satisfy domestic sanitary and phytosanitary (plant health) policies. Thus, in Figure 2 we disaggregate the prevalence of NTMs by type across (i) sanitary and phytosanitary measures, (ii) technical barriers to trade, (iii) pre-shipment inspection and other formalities, and (iv) charges, taxes, and other para-tariff measures. For simplicity, we restrict attention to a few selected industries and the aggregate of all industries to illustrate the overall patterns.
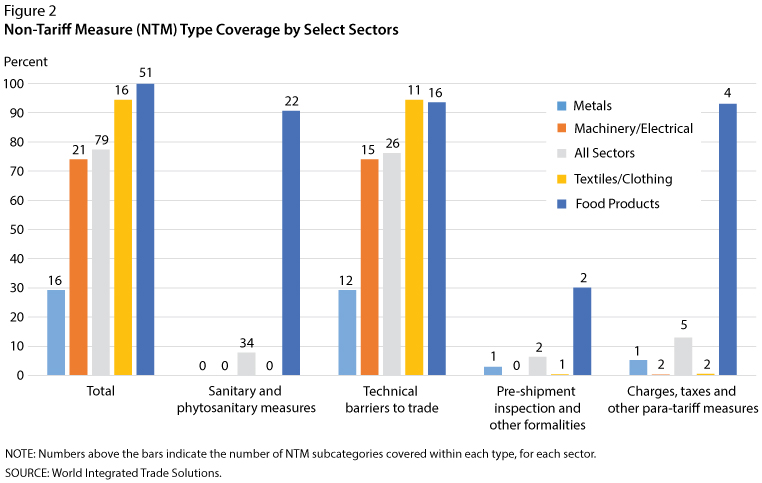
We observe that the prevalence of NTMs varies significantly by type. While the total NTM coverage for all industries is over 75%, NTM coverage is close to 80% for technical barriers but less than 20% coverage for sanitary, inspection, and additional requirements. Technical barriers to trade include import authorizations and licensing, labeling and packaging requirements, and product quality and safety requirements. Some of these may be critical to ensure the safety of US consumers, but others may be in place to limit the extent of international trade.
We also observe that the type of NTM in place varies widely across industries. On one hand, sanitary and phytosanitary requirements cover more than 90% of imports of food products but have no coverage of Metals, Machinery/Electrical, or Textiles/Clothing imports. This category includes requirements on hygiene standards, pest elimination treatments, and conformity assessments, which naturally apply to food products but are not relevant to the other sectors. On the other hand, technical NTMs cover more than 75% of imports of Machinery/Electrical. Again, some of these may be in place to ensure safety standards, but they may also reflect the goal of protecting domestic industries from foreign competition.5
This essay documents many ways international trade in the US is obstructed beyond ad valorem tariffs. Even if NTMs are in place to address legitimate considerations, such as the safety of US consumers and the quality of inputs used by US firms, it is important to keep in mind that these policies also distort international trade flows, potentially hurting US consumers and firms. While this phenomenon suggests a tradeoff between the safety/health/quality of US imports and international trade barriers, this need not be the case. Countries can expand international trade agreements to ensure the standards of the goods traded: Economies with similar levels of economic development, such as the US and Europe, could expand trade agreements to accept each other's health and safety standards, thereby ensuring these ultimate goals are met and that trade is open.
Notes
1 There are certainly some costs of trade, particularly during periods of transition following policy changes. Yet the long-run effects of trade on growth and development are overwhelmingly estimated to be positive.
2 United Nations Conference on Trade and Development. "International Classification of Non-Tariff Measures." 2019; https://unctad.org/system/files/official-document/ditctab2019d5_en.pdf.
3 World Integrated Trade Solutions. "Tariff and Trade Analysis." http://wits.worldbank.org/WITS/WITS/AdvanceQuery/TariffAndTradeAnalysis/AdvancedQueryDefinition.aspx?Page=TariffandTradeAnalysis; and "United States Non-Tariff Measure Statistics." https://wits.worldbank.org/tariff/non-tariff-measures/USA.
4 Some papers have estimated values for the ad valorem equivalent costs of these NTM coverages. See Cadot, O. and Gourdon, J. "Non-Tariff Measures, Preferential Trade Agreements, and Prices: New Evidence." Review of World Economics, 2016, 152, pp. 227-49; https://doi.org/10.1007/s10290-015-0242-9. And see Kinzius, L.; Sandkamp, A. and Yalcin, E. "Trade Protection and the Role of Non-Tariff Barriers." Review of World Economics, 2019, 155, pp. 603-43; https://doi.org/10.1007/s10290-019-00341-6.
5 For a further discussion on the reasoning behind NTM implementation, see Herghelegiu, C. "The Political Economy of Non-Tariff Measures." World Economy, 2018, 41(1), pp. 262-86; https://doi.org/10.1111/twec.12582.
© 2023, Federal Reserve Bank of St. Louis. The views expressed are those of the author(s) and do not necessarily reflect official positions of the Federal Reserve Bank of St. Louis or the Federal Reserve System.