Predicting the Yield Curve Inversions that Predict Recessions: Part 1
In a recent post, we discussed the data behind the fear of yield curve inversions.1 With the recent turmoil among financial markets, the yield spread between the Treasury 10-year and 1-year notes stands at 14 basis points. In recent weeks, it has shrunk to as little as 11 basis points. Dozens of financial reporters and outlets have been following the yield curve closely, as it's been established as an accurate leading indicator of a U.S. recession.
Traditionally, investors have seen a yield curve inversion as a signal that a recession will follow in the not-too-distant future. An inverted yield curve signals that investors believe current growth is stronger than future growth, which makes a recession more likely as businesses and investors slow spending and investing because of these expectations. The goal of this essay is to identify how effective other leading indicators are at predicting recessions.
There are many well-known leading indicators of U.S. recessions, such as consumer expectations and manufacturing employment, to name just two. The key is to find a variable that consistently predicts a recession. In this essay, we identify other leading indicators and plot their trends around yield curve inversions using the spread between the Treasury 10-year and 1-year notes.2 To do so, we analyze macrovariables to determine whether other indicators decline prior to a yield curve inversion and whether these variables consistently predict recessions.
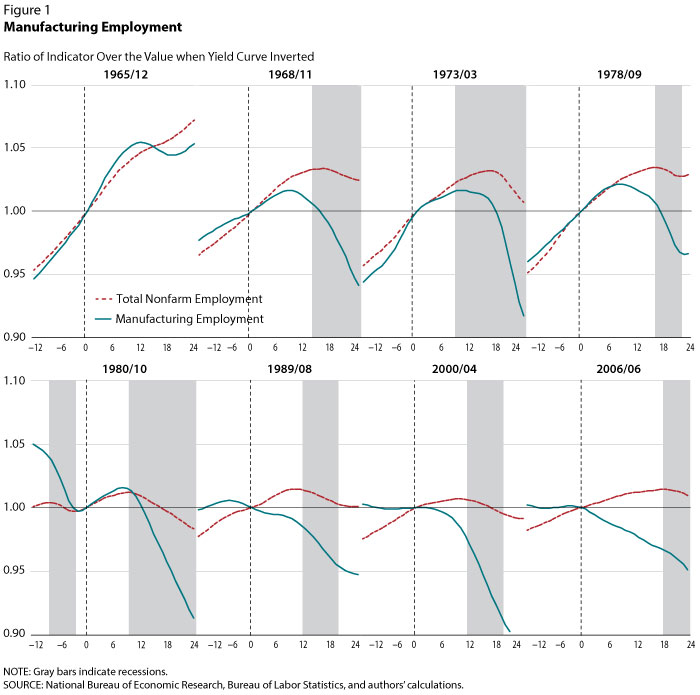
The figures in this essay display graphs of normalized trends of monthly data. The graphs are labeled at the top in a YYYY/MM format. The dates displayed indicate in which month the yield curve inverted, and each graph plots high-frequency data for one year before and two years after an inversion. The plots are normalized so that the dates of yield curve inversions are labeled as 0 on the x-axes and as 1 on the y-axes. The gray shaded regions in the graphs represent months of recessions according to the National Bureau of Economic Research. A series is thought to be "leading" to an event if it consistently exhibits the same trend prior to each event. In this essay, we seek to identify series that consistently decrease prior to yield curve inversions and recessions.

Figure 1 shows normalized trends in manufacturing employment and total nonfarm employment prior to each yield curve inversion since 1965: Total nonfarm employment is used as a proxy for economic output. As can be seen, recessions tend to occur 10 to 18 months after an inversion. Manufacturing employment has been traditionally considered a fundamental leading indicator of U.S. recessions, and as Figure 1 shows, it periodically precedes yield curve inversions. Chronologically, it appears that decreases in manufacturing employment generally occur after a yield curve inversion but before a recession. Manufacturing represents approximately one-fifth of the U.S. economy, so it is perhaps not surprising that it does not experience significant decreases more than a year prior to a recession. These plots demonstrate that manufacturing output is not an earlier or more reliable indicator of a recession than the yield curve.

The construction sector is also considered a fundamental leading indicator of the business cycle, given its correlation with the U.S. housing cycle. Figure 2 plots the dynamics of employment for the construction sector as a proxy for the housing cycle in the U.S. and compares it with the dynamics of total nonfarm employment using the methodology described above: The use of construction employment yields similar results to the use of manufacturing employment. In some cycles, notably the episode of October 1980, construction employment slows prior to a yield curve inversion. However, construction employment generally moves contemporaneously with total employment prior to yield curve inversions. Similar to manufacturing, this seems to rule out current housing trends as an earlier and more consistent leading indicator than yield curve inversions.
While the series analyzed in this essay are shown to lead to recessions, it appears as though fundamental macroeconomic indicators do not decrease prior to yield curve inversions but only do so immediately prior to a recession. In almost all cases, yield curve inversions preceded declines in these series. In our Part 2 essay, we will analyze how macroeconomic expectations provide more forecasting power for yield curve inversions and recessions.
Notes
1 See https://fredblog.stlouisfed.org/2018/10/the-data-behind-the-fear-of-yield-curve-inversions/.
2 Many analyses use the 2-year and 10-year note spread. The 1-year and 2-year notes are highly correlated: In periods when the 2-year/10-year spread has inverted, so has the 1-year/10-year spread.
© 2019, Federal Reserve Bank of St. Louis. The views expressed are those of the author(s) and do not necessarily reflect official positions of the Federal Reserve Bank of St. Louis or the Federal Reserve System.


 follow @stlouisfed