
Federal Reserve Economic Data: Your trusted data source since 1991
Your trusted data source
since 1991.
NOTES
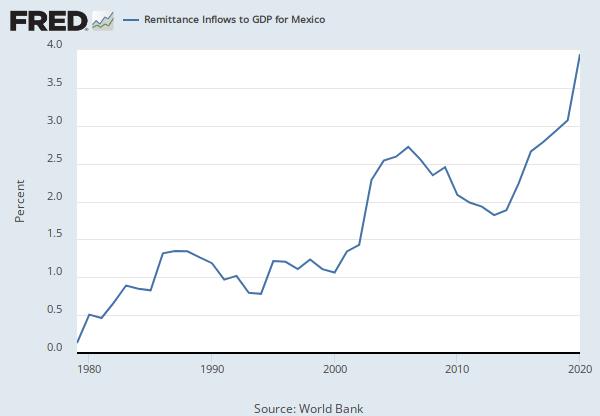
Source: World Bank
Release: Global Financial Development
Units:
Frequency:
Notes:
Total value of all traded shares in a stock market exchange as a percentage of GDP. (Standard & Poor's, Global Stock Markets Factbook and supplemental S&P data)
Source Code: GFDD.DM.02
Suggested Citation:
World Bank, Stock Market Total Value Traded to GDP for Mexico [DDDM02MXA156NWDB], retrieved from FRED, Federal Reserve Bank of St. Louis; https://fred.stlouisfed.org/series/DDDM02MXA156NWDB, April 14, 2024.
RELATED DATA AND CONTENT
Data Suggestions Based On Your Search


Content Suggestions


Related Categories
Stock Market Data
Financial Indicators
Money, Banking, & Finance
Indicators
Mexico
Countries
International Data