Federal Reserve Economic Data: Your trusted data source since 1991
Your trusted data source
since 1991.
NOTES
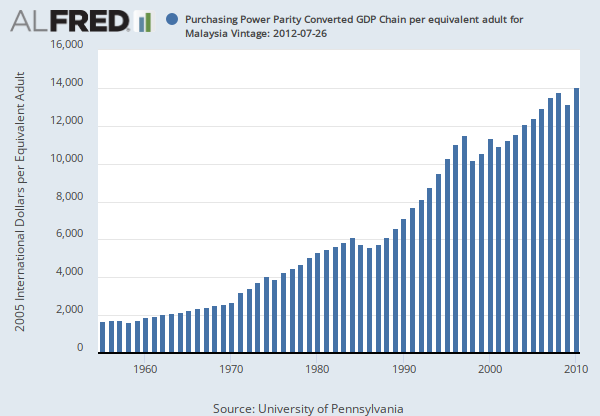
Source: University of Pennsylvania
Release: Penn World Table 7.1
Units:
Frequency:
Notes:
The equivalent measure used here assigns a weight of 1.0 to all persons over 15, and 0.5 for those under age 15.
For more information and proper citation see http://www.rug.nl/research/ggdc/data/pwt/pwt-7.1
Source Indicator: rgdpeqa
Suggested Citation:
University of Pennsylvania, Purchasing Power Parity Converted GDP Chain per equivalent adult for Malaysia [RGDPEQMYA626NUPN], retrieved from FRED, Federal Reserve Bank of St. Louis; https://fred.stlouisfed.org/series/RGDPEQMYA626NUPN, April 18, 2024.
RELATED DATA AND CONTENT
Data Suggestions Based On Your Search


Content Suggestions